
Google Expands Heat Resilience Tool to 50 Cities to Fight Urban Heat
Google Research expands its AI-powered rooftop reflectivity dataset to 50+ cities globally, publishing the methodology in Nature Communications and launching a free interactive Earth Engine app.
Takeaways
- Google Research expanded its Heat Resilience rooftop reflectivity dataset from 14 pilot cities to 50+ cities across 9 countries, now including London, São Paulo, NYC, and more.
- A new AI fusion model combines free Sentinel-2 satellite data with 30-cm Airbus commercial imagery to map albedo at individual building resolution -- a 30x resolution improvement.
- The methodology is published in Nature Communications and validated against airborne hyperspectral sensors, achieving an RMSE of just 0.04.
- Building-level cool-roof planning using this data could mitigate urban heat by up to 0.5°C globally, with individual buildings seeing larger local effects.
- The dataset and interactive Heat Resilience Earth Engine App are free and publicly available today; raw data is on Harvard Dataverse under CC BY 4.0.
- Current limitation: the tool models land surface temperature, not air temperature; air temperature modeling is ongoing future work.
Extreme heat kills an estimated 500,000 people every year, and cities bear the worst of it. Urban heat islands -- areas where roads and buildings absorb and re-emit heat -- cause cities to warm at twice the global average rate. Google Research just made a significant move to help city planners fight back: it has expanded its Heat Resilience dataset from 14 pilot cities to 50+ cities across 9 countries, backed by a peer-reviewed paper in Nature Communications and a new free interactive mapping tool.
From pilot to planet
The story starts in 2024, when Google piloted the Heat Resilience approach with 14 U.S. cities. Miami-Dade County used it to develop policies that incentivize developers to take heat mitigation measures. Stockton used an earlier version to gather data for potential projects and opportunities to reduce urban heat islands. The results were promising enough to justify a full global push.
Now the dataset covers major urban centers across Europe, Brazil, and the United States. New additions include London, Athens, Barcelona, Rio de Janeiro, São Paulo, Los Angeles, Austin, and New York City. The data is free, open, and accessible today through the new Heat Resilience Earth Engine App.
The resolution problem they had to solve
The core technical challenge here is a familiar one in geospatial ML: freely available satellite data is too coarse to be actionable. Sentinel-2 albedo estimates are freely available globally, but their 10-meter spatial resolution is insufficient to resolve individual rooftops. A 10-meter pixel averages over an entire building, a parking lot, and a patch of grass -- useless for targeting a specific roof for a cool-roof retrofit.
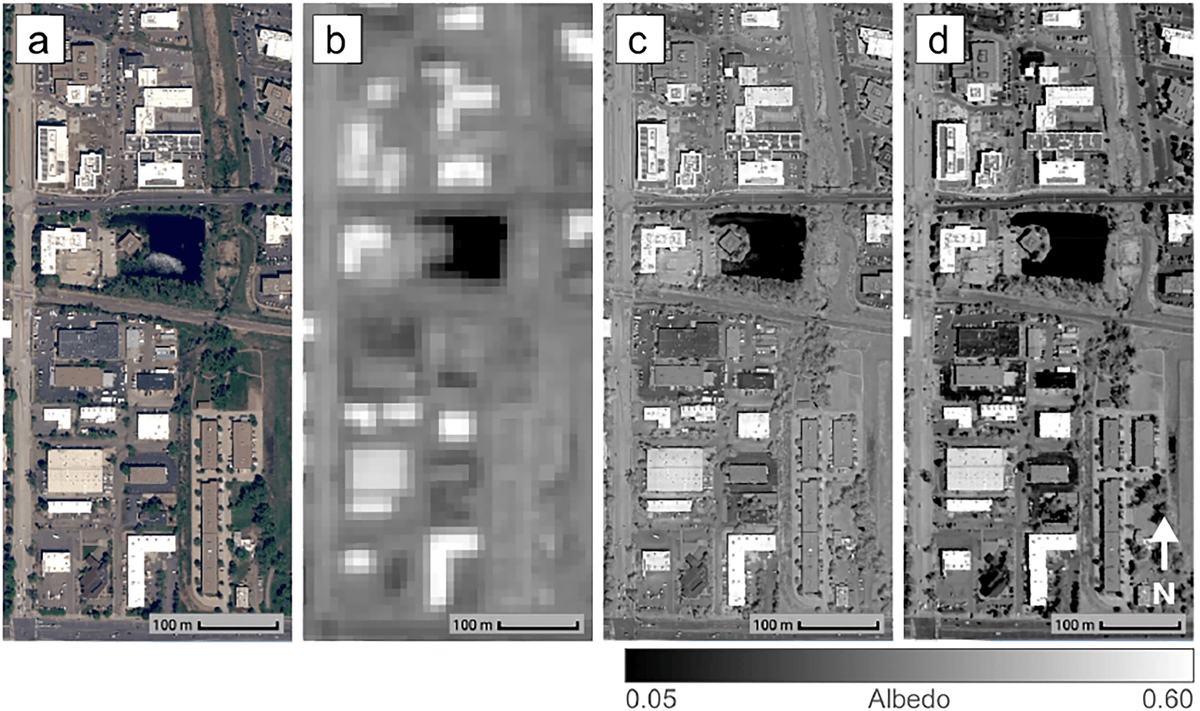
Google's solution was a data fusion approach. They fused Sentinel-2 satellite data with high-resolution 30-centimeter commercial imagery from Airbus Pléiades Neo, using machine learning models and radiometric calibration techniques to blend the radiometric accuracy and global coverage of Sentinel-2 with the precise spatial detail of the commercial imagery. Radiometric calibration here means correcting for how different sensors measure light intensity differently, so that data from two very different satellites can be meaningfully combined.
The result is a 30x improvement in spatial resolution -- from 10 meters down to 30 centimeters -- enough to isolate a single rooftop. By blending data captured across different wavelengths, the model reconstructs a comprehensive spectral reflectance profile for each urban pixel.
How it was built and validated
To ensure accuracy, the team validated their method against high-resolution airborne hyperspectral measurements collected over Boulder, Colorado. The fused 30-cm albedo maps achieved a root mean square error (RMSE) of just 0.04 relative to the ground-truth data. RMSE of 0.04 on an albedo scale of 0 to 1 is tight -- it means the model's reflectivity estimates are, on average, off by only about 4 percentage points from what an aircraft sensor would measure directly overhead.
The methodology is now published in Nature Communications, and the underlying albedo dataset for all 50+ cities is available at the Harvard Dataverse under a CC BY 4.0 license. The authors note that the methods could be applied to any RGBN imagery -- meaning any camera that captures red, green, blue, and near-infrared bands -- so the pipeline is not locked to Airbus data.
What the data actually tells you
Albedo (reflectivity) is the key metric. A dark asphalt roof has an albedo around 0.05 -- it absorbs 95% of incoming solar radiation. A white cool roof can hit 0.75 or higher. The paper introduces a high-resolution 30-cm urban albedo dataset and demonstrates how building-level cool-roof planning could mitigate extreme heat by up to 0.5°C in global cities.
That 0.5°C figure is a global average across all 50+ cities. In dense urban cores with large flat-roofed commercial buildings -- the highest-value targets -- the local effect can be considerably larger. Cool roofs have been found to reduce peak energy demand for cooling by up to 27%.
What the app gives you
The Heat Resilience Earth Engine App is live now and free to use. Its key features:
- Building-level visualization: Albedo displayed as centroids on a map, so you can immediately spot the darkest (most heat-absorbing) roofs in any neighborhood.
- Baseline analysis: Tools to understand current city-wide reflectivity and track changes over time as cool-roof programs roll out.
- Data download: Export the high-resolution dataset for local analysis, policy documents, or integration into your own pipelines.
- Dynamic zoom: A nested interface that transitions from census-tract-level aggregates all the way down to individual building insights.
Where it falls short
The tool measures land surface temperature effects, not air temperature. It measures land surface temperatures rather than air temperature because the former provides higher spatial resolution and is available globally -- air temperature data is much more sparsely available and requires additional weather factors for accurate modeling. This is a meaningful distinction: surface temperature and the air temperature a person actually breathes are related but not the same thing.
Google is working on longer-term research to model the effects of cooling interventions on air temperature. There is also a known seasonal tradeoff: the high reflectivity of cool roofs may have adverse effects in winter, as increased solar radiation reflection during colder months heightens indoor heating demands. The app does not currently model this winter penalty, so planners in colder climates should weigh it separately.
The bigger picture
The real breakthrough here is not just the dataset -- it is the shift from passive observation to actionable targeting. In the past, you could understand land characteristics at a lower resolution and just at an area level. But with AI improvements, it is now possible to understand the roof reflectance of individual roofs. That granularity is what turns a climate dataset into a procurement list: a city can now rank every large commercial rooftop by heat-absorption impact and prioritize retrofits accordingly.
This release is part of Google's broader Google Earth AI initiative, which applies geospatial ML to planetary-scale problems. It was developed in collaboration with the World Resources Institute, and the underlying dataset is openly licensed -- meaning municipalities, NGOs, and researchers worldwide can build on it without any cost barrier.