
Lovable Ships Built-in Analytics So Builders Stop Flying Blind
Lovable now ships a built-in analytics dashboard with every published app, giving builders real-time visitor data, traffic sources, and device breakdowns with zero setup.
Takeaways
- Built-in analytics: Lovable now includes an automatic analytics dashboard for all published apps, requiring zero setup or configuration.
- Core metrics: Tracks real-time visitors, pageviews, bounce rate, visit duration, traffic sources, and device/country breakdowns.
- Time filters: Data is filterable from today up to the last 90 days, defaulting to the last 7 days.
- Key limitation: No event tracking, user identification, funnels, retention, or cohort analysis -- it's traffic-layer only.
- Best use case: Landing pages, marketing sites, and early-stage validation where confirming traffic arrival is the primary question.
- Going deeper: For product-level behavior, Lovable supports integrations like Amplitude with a native MCP connector inside the platform.
If you've ever shipped a Lovable app and immediately wondered whether anyone was actually using it, that problem just got a lot smaller. Lovable has rolled out a built-in analytics dashboard that activates automatically when you publish a project, no third-party scripts, no manual instrumentation, no configuration required.
Zero setup, instant signal
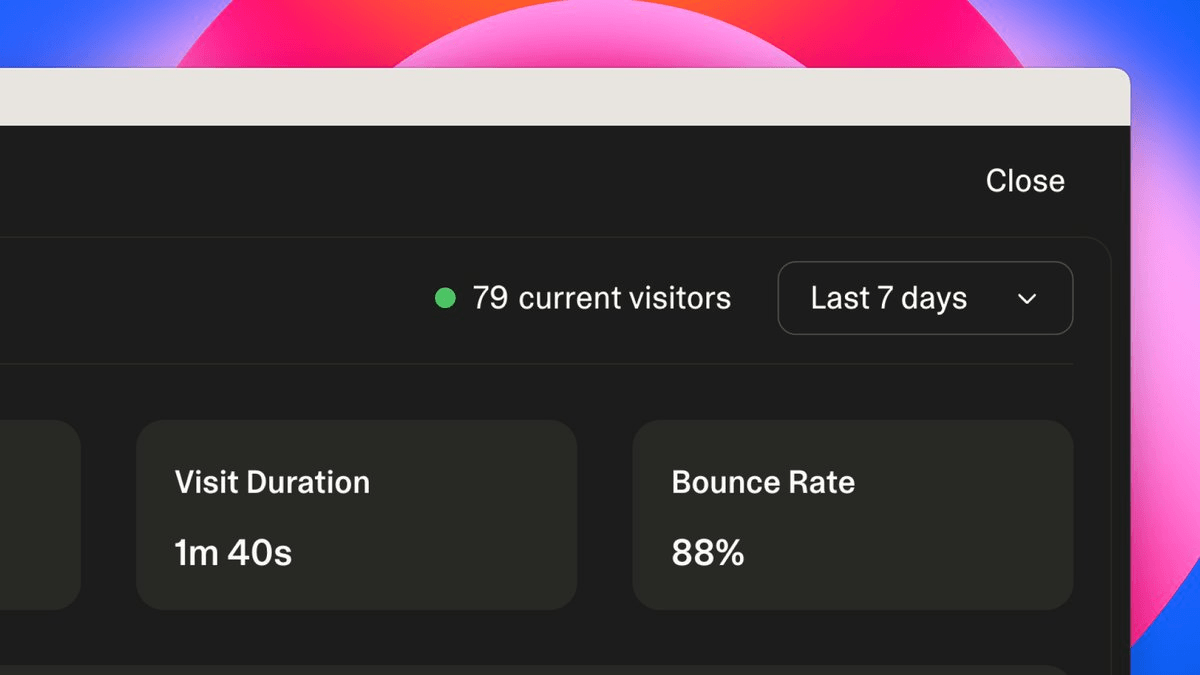
The dashboard tracks visitors, pageviews, bounce rate, visit duration, traffic sources, and device usage for published projects. It's live the moment your app goes public. By default, analytics data is shown for the last 7 days, and you can change the time period using the dropdown at the top of the Analytics view.
The full range of time filters available:
- Today
- Yesterday
- Last 24 hours
- Last 7 days (default)
- Last 14 days
- Last 30 days
- Last 90 days
- This month
What you actually get
The dashboard is organized around four core views, each answering a distinct question about your traffic:
- Real-time visitor count -- live headcount of who's on your app right now, updating as traffic moves
- Page views, visit duration, and bounce rate -- which pages are getting traction and where people are dropping off
- Traffic sources -- direct, referral, and organic search breakdowns, useful when running campaigns
- Country and device breakdown -- where visitors are coming from and whether they're on desktop, mobile, or tablet
Think of this as web analytics at its simplest: it confirms your app is live and people are finding it. That's useful for validation. If you launched a landing page or a simple marketing site, the built-in dashboard answers the only question that matters at that stage: "Is anyone showing up?"
The ceiling is real
This is a traffic layer, not a product analytics layer, and that distinction matters a lot depending on what you've built. Where it stops: no event tracking, no user identification, no funnels, no retention analysis, no custom properties, no cohort analysis, no experimentation.
Consider a Lovable-built SaaS tool with a three-step onboarding flow. Your built-in dashboard shows 200 daily visitors. What it can't show: 60% of signups abandon onboarding at step two, mobile users convert at half the rate of desktop, and the users who complete onboarding in under three minutes retain at 3x the rate of everyone else. Those are the numbers that change what you build next.
For anything beyond a landing page, you'll want to layer in a proper product analytics tool. You can use Lovable's built-in dashboard for basic traffic metrics, or integrate a product analytics tool like Amplitude for event tracking, user identification, and behavioral analysis. Amplitude has a native MCP connector inside Lovable, and their setup guide walks through three installation paths depending on how much instrumentation you need.
Who this is actually for
The sweet spot here is the early-stage builder who just shipped something and wants a sanity check. Before this, you either had to wire up Google Analytics manually (which requires extra configuration for Lovable's React single-page app output) or fly completely blind. Now the baseline is covered automatically.
Concretely, the built-in dashboard is the right tool when:
- You shipped a landing page or marketing site and want to know if traffic is coming in
- You're running a campaign and need to see which source is driving visits
- You want to know whether mobile or desktop users dominate your audience before investing in layout work
- You need a quick read on bounce rate to decide if your copy or load time needs attention
The official docs confirm the feature is available now for all published projects, with no additional plan required to access the dashboard. It sits under the "Optimize" section of the Lovable project sidebar, right alongside deployment and security tooling, which signals that Lovable is starting to think about the post-ship lifecycle, not just the build phase.
For solo builders and small teams validating ideas fast, having traffic data baked in from day one removes one more reason to skip instrumentation entirely. The data is there. Whether you act on it is still up to you.