
Apple's Embedding Atlas Renders 4 Million Points at 60fps for Free
Apple open-sources Embedding Atlas, a WebGPU-powered tool that lets you interactively explore millions of embedding vectors with zero friction
Takeaways
- Apple open-sourced Embedding Atlas, an interactive visualization tool for large-scale embeddings, free under MIT license.
- Handles millions of points at 60fps via WebGPU rendering, with WebGL 2 fallback for broader browser support.
- Automatic clustering and labeling runs in milliseconds using a Rust+Wasm density algorithm on the 2D projected space.
- Full metadata cross-filtering powered by DuckDB-in-browser — filter charts and the embedding map simultaneously, all locally.
- MCP support lets AI agents query schema, run SQL, and create charts programmatically via Model Context Protocol.
- Available as CLI, Jupyter widget, Streamlit component, and npm package with React and Svelte bindings.
Embedding Atlas is Apple's open-source answer to a problem every ML practitioner knows: you have a million embedding vectors, you run UMAP, and you end up staring at a blob of overlapping dots with no idea what's actually in there. The tool, built by researchers at the intersection of HCI and machine learning, turns that blob into a navigable, filterable, labeled map , and it does it fast enough to feel interactive.
The friction problem
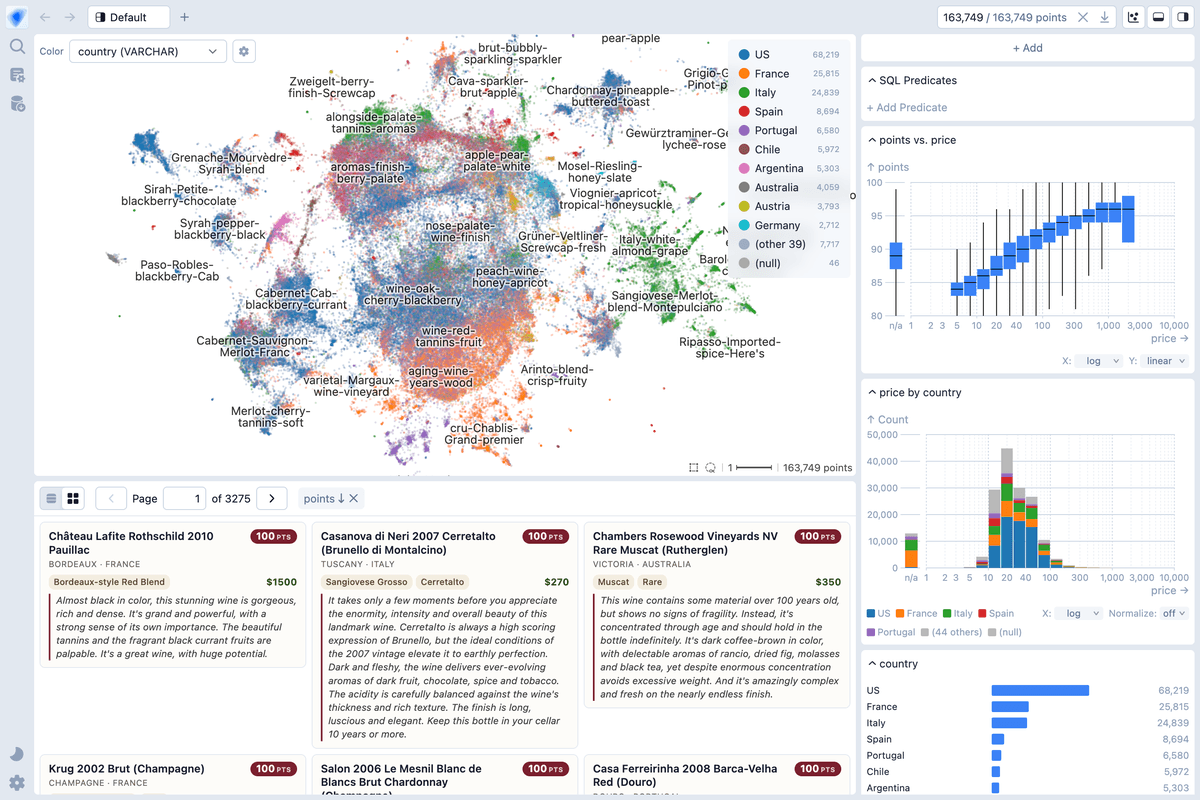
People often encounter "friction" when using embedding visualization tools: barriers to adoption like tedious data wrangling and loading, scalability limits, no integration of results into existing workflows, and limitations in possible analyses without integration with external tools to show coordinated views of metadata. Embedding Atlas is designed from the ground up to eliminate that friction. Load the wine reviews demo and you'll see nearly 200,000 reviews scatter into a landscape that makes immediate visual sense. Clusters self-label. Density contours rise like topographic lines. Filter by country or rating and the map reshapes itself in real time.
What it actually does
Embedding Atlas provides interactive visualizations for large embeddings and their metadata , you can visualize, cross-filter, and search across your data. The feature set goes well beyond a scatterplot:
- Automatic clustering and labeling: Interactively visualize and navigate overall data structure.
- Kernel density estimation and contours: Easily explore and distinguish between dense regions of data and outliers.
- Real-time search and nearest neighbors: Find similar data to a given query or existing data point.
- Scale: Smooth performance up to a few million points, powered by WebGPU.
- Linked dashboards and cross-filtering: