
Kanaries' RATH Automates Data Exploration and Beats Tableau Without Code
Kanaries RATH brings one-click automated EDA, causal discovery, and an embeddable Tableau-like component to your data stack — all open source under AGPL
Takeaways
- One-click EDA: RATH's AutoPilot engine automatically surfaces patterns, correlations, and multi-dimensional visualizations from any dataset.
- Causal discovery built in: Goes beyond correlation with an interactive causal graph, what-if analysis, and editable causal models — rare in open-source BI tools.
- Embeddable Graphic Walker: A lightweight (~400KB gzipped) React component for drag-and-drop visualization that can be dropped into any web app.
- Broad database support: Connects to MySQL, PostgreSQL, ClickHouse, Redshift, Spark SQL, AirTable, and more, plus CSV/JSON file upload.
- Open source & free: AGPL-3.0 licensed with a live sandbox demo at rath.kanaries.net — no sign-up needed.
- Still alpha: Causal analysis module is explicitly alpha-stage; may struggle with very large or noisy datasets and lacks full data source coverage.
RATH, by Kanaries, is an open-source automated data exploration and visualization platform that has been quietly gaining traction with nearly 4,700 GitHub stars. The pitch is straightforward: drop in your data, click a button, and let the engine surface patterns, correlations, and causal relationships you would have spent hours hunting for manually. It positions itself squarely against tools like Tableau and Power BI , but with a fundamentally different philosophy around automation.
RATH automates the Exploratory Data Analysis (EDA) workflow with an Augmented Analytic engine that discovers patterns, insights, and causals, presenting them through auto-generated multi-dimensional visualizations. EDA is the process of summarizing and visually exploring a dataset before formal modeling , typically the most time-consuming part of any data project. RATH's bet is that most of that work can be automated.
The engine under the hood
RATH leverages machine learning algorithms to automate the EDA process, with its augmented analytic engine quickly identifying patterns, insights, and causals within the data and presenting them in a clear, easy-to-understand format. The visualization selection is not random , RATH generates and recommends visualizations based on minimizing visual perception error of information in visualizations. In other words, it picks chart types that are statistically least likely to mislead you.
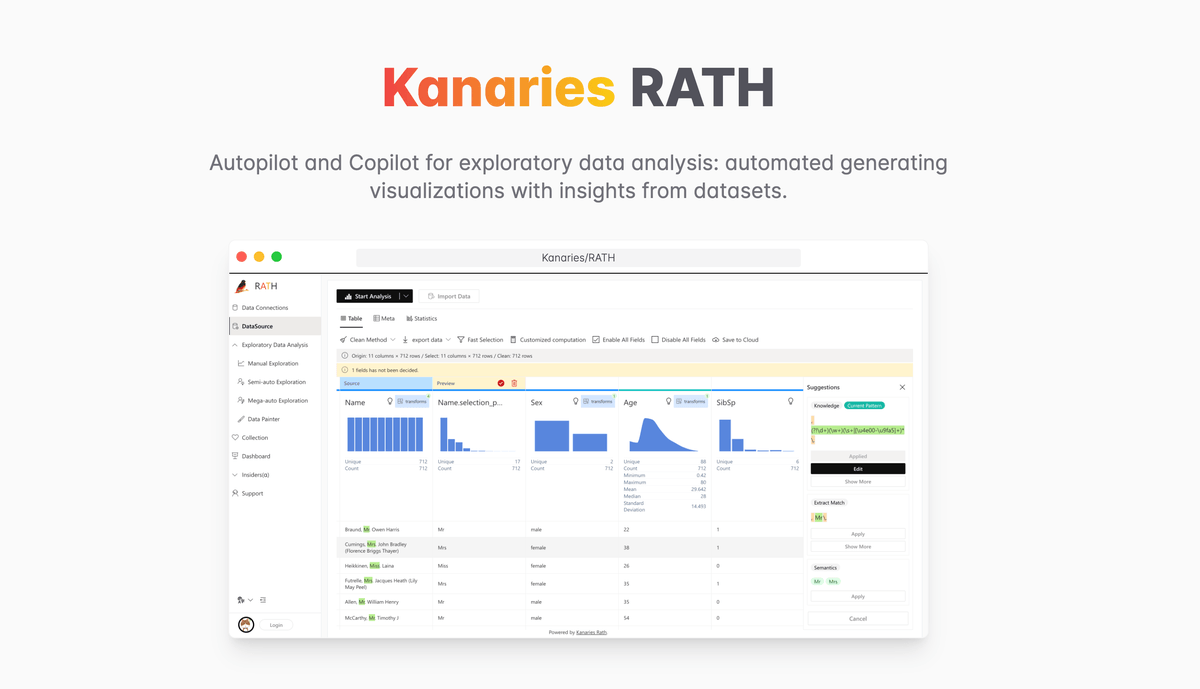
The Data Autopilot tab gives you data insights in the span of one click. Simply import your data to RATH and click the Start Analysis button. From there, RATH automatically suggests many related data visualizations in the Associated Patterns and Associated Features sections. Once you find a visualization that interests you, click the related insights button and RATH will generate new visualizations about it.