
Kanaries' RATH Automates Data Exploration so Analysts Find Insights Instantly
An open-source Tableau alternative that automates exploratory data analysis with causal discovery, one-click insights, and a GPT-powered natural language interface.
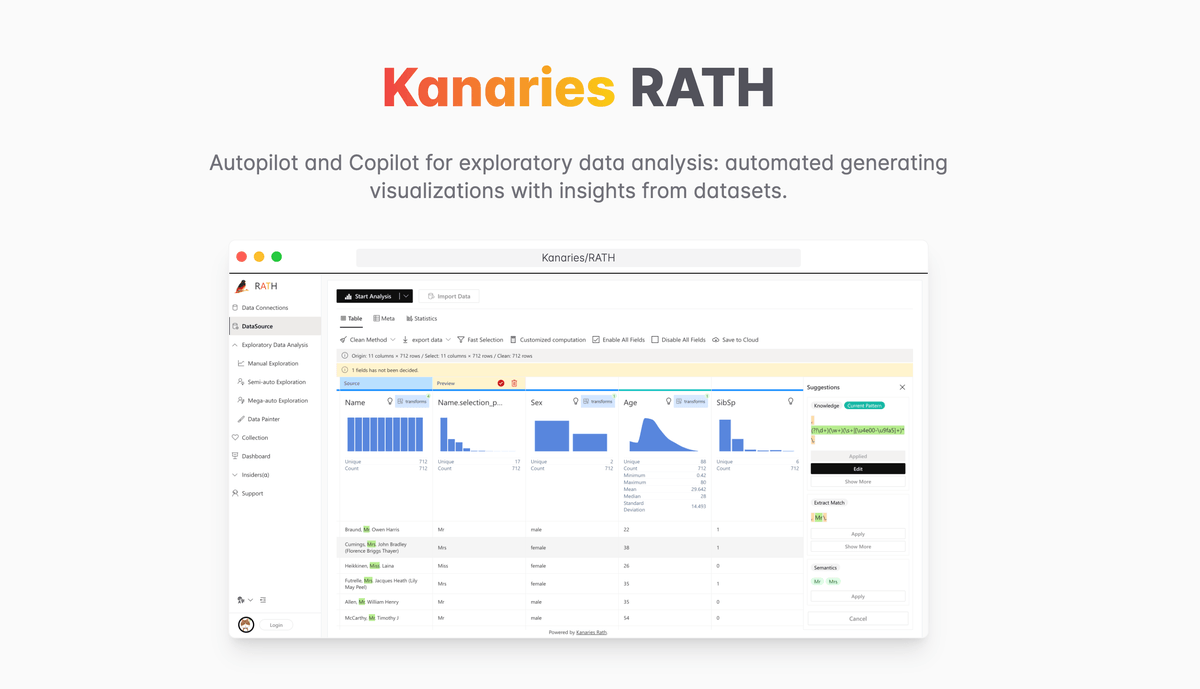
Takeaways
- Kanaries/RATH is an open-source automated EDA and visualization platform, roughly 4.7k stars.
- Augmented analytics engine picks charts by minimizing visual perception error, not aesthetics.
- Three modes: one-click AutoPilot, learning Copilot, and GPT-powered natural language queries.
- Alpha causal discovery feature builds editable causal graphs and trains ML models from them.
- Connects to MySQL, Postgres, Redshift, Athena, ClickHouse, Spark SQL, Hive, Doris, AirTable and more.
- Embeddable Graphic Walker component; licensed AGPL-3.0.
Exploratory data analysis eats time without producing anything shippable. You load a dataset, stare at histograms, drag columns around a chart builder, and hope something interesting jumps out. RATH, an open-source project from Kanaries with roughly 4.7k GitHub stars, tries to short-circuit that loop by treating EDA as a search problem the machine should solve for you.
RATH pitches itself as more than a Tableau clone. It automates the EDA workflow with an augmented analytics engine that hunts for patterns, insights, and causal links, then renders them as auto-generated multi-dimensional charts. The interesting bit is the scoring function behind the recommendations: charts are picked to minimize visual perception error, meaning the system optimizes for how accurately a human reads a plot rather than how attractive it looks.
One click, or one conversation
The tool exposes three workflows for getting insights out of a dataset, and knowing which one to reach for is most of the learning curve.
- AutoPilot — Import your data, hit Start Analysis, and the Data Autopilot tab returns a batch of insights in a single click.
- Copilot