
nvitop Replaces nvidia-smi With a Smarter Open-Source GPU Monitor
nvitop goes far beyond nvidia-smi: a Python-native GPU monitor with interactive TUI, programmable APIs, and Prometheus/Grafana integration
Takeaways
- nvitop is a Python-native NVIDIA GPU monitor with an interactive TUI, Python API, and Prometheus/Grafana support — available at GitHub.
- Queries NVML directly (no nvidia-smi parsing), giving faster and richer data including per-process GPU memory, SM utilization, and runtime.
- Interactive monitor supports process kill/terminate via keystrokes, tree-view, environment variable inspection, and per-process live metric graphs.
- Bundled
nviselCLI andselect_devices()Python function auto-select free GPUs by memory, utilization, and count constraints. ResourceMetricCollectorlogs GPU/CPU metrics asynchronously during training loops and integrates with TensorBoard and CSV export.- Free and open-source (Apache-2.0 / GPL-3.0); installs via
pip install nvitoporuvx nvitop; requires Python 3.8+ and an NVIDIA driver.
nvitop is an open-source Python tool that replaces nvidia-smi as your day-to-day GPU monitoring interface. It has quietly grown to nearly 7,000 GitHub stars, and for good reason: it ships a colorful interactive terminal UI, a CUDA device selection CLI, a full Python API, and a Prometheus exporter that feeds Grafana dashboards, all from a single pip install nvitop.
The problem with nvidia-smi
nvidia-smi is a snapshot tool. It prints a table and exits. If you want continuous monitoring you have to wrap it in a watch loop, and even then the output is plain text that must be parsed. Every alternative tool that parses nvidia-smi output inherits its latency and fragility. nvitop sidesteps this entirely by talking directly to NVML (NVIDIA Management Library) through Python bindings, which means faster queries, richer data, and no brittle string parsing.
The interactive monitor
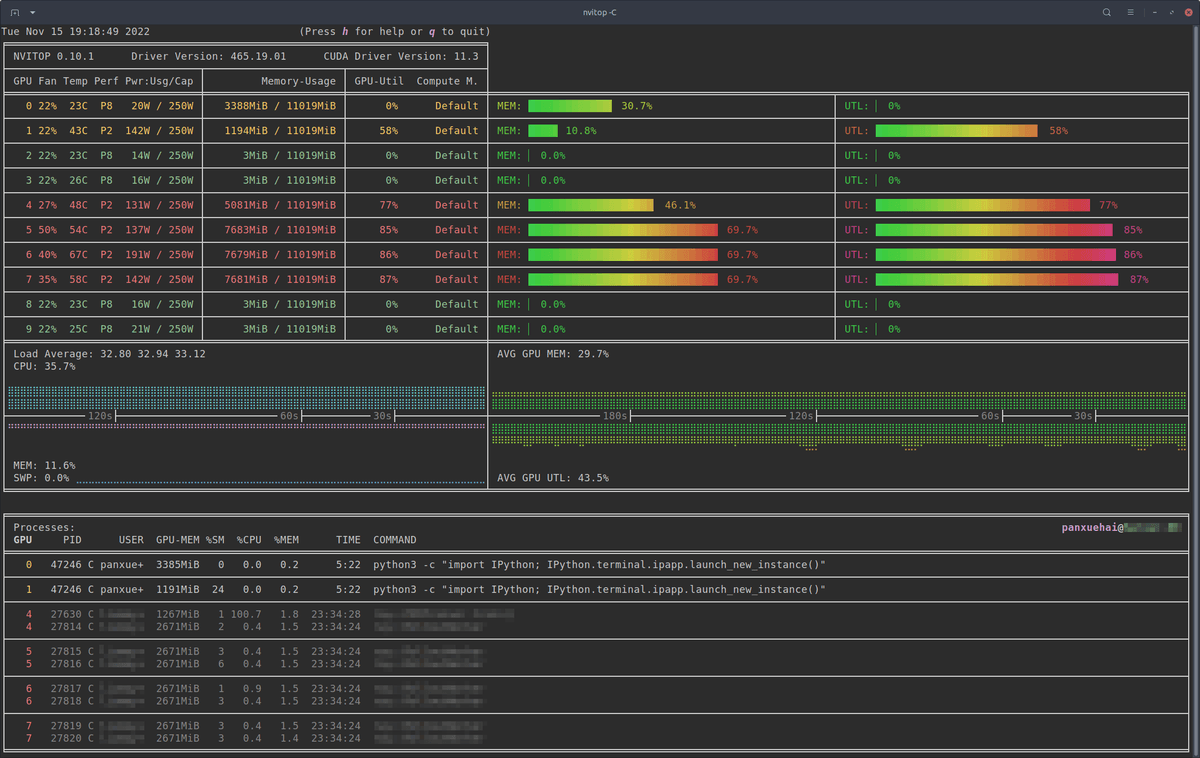
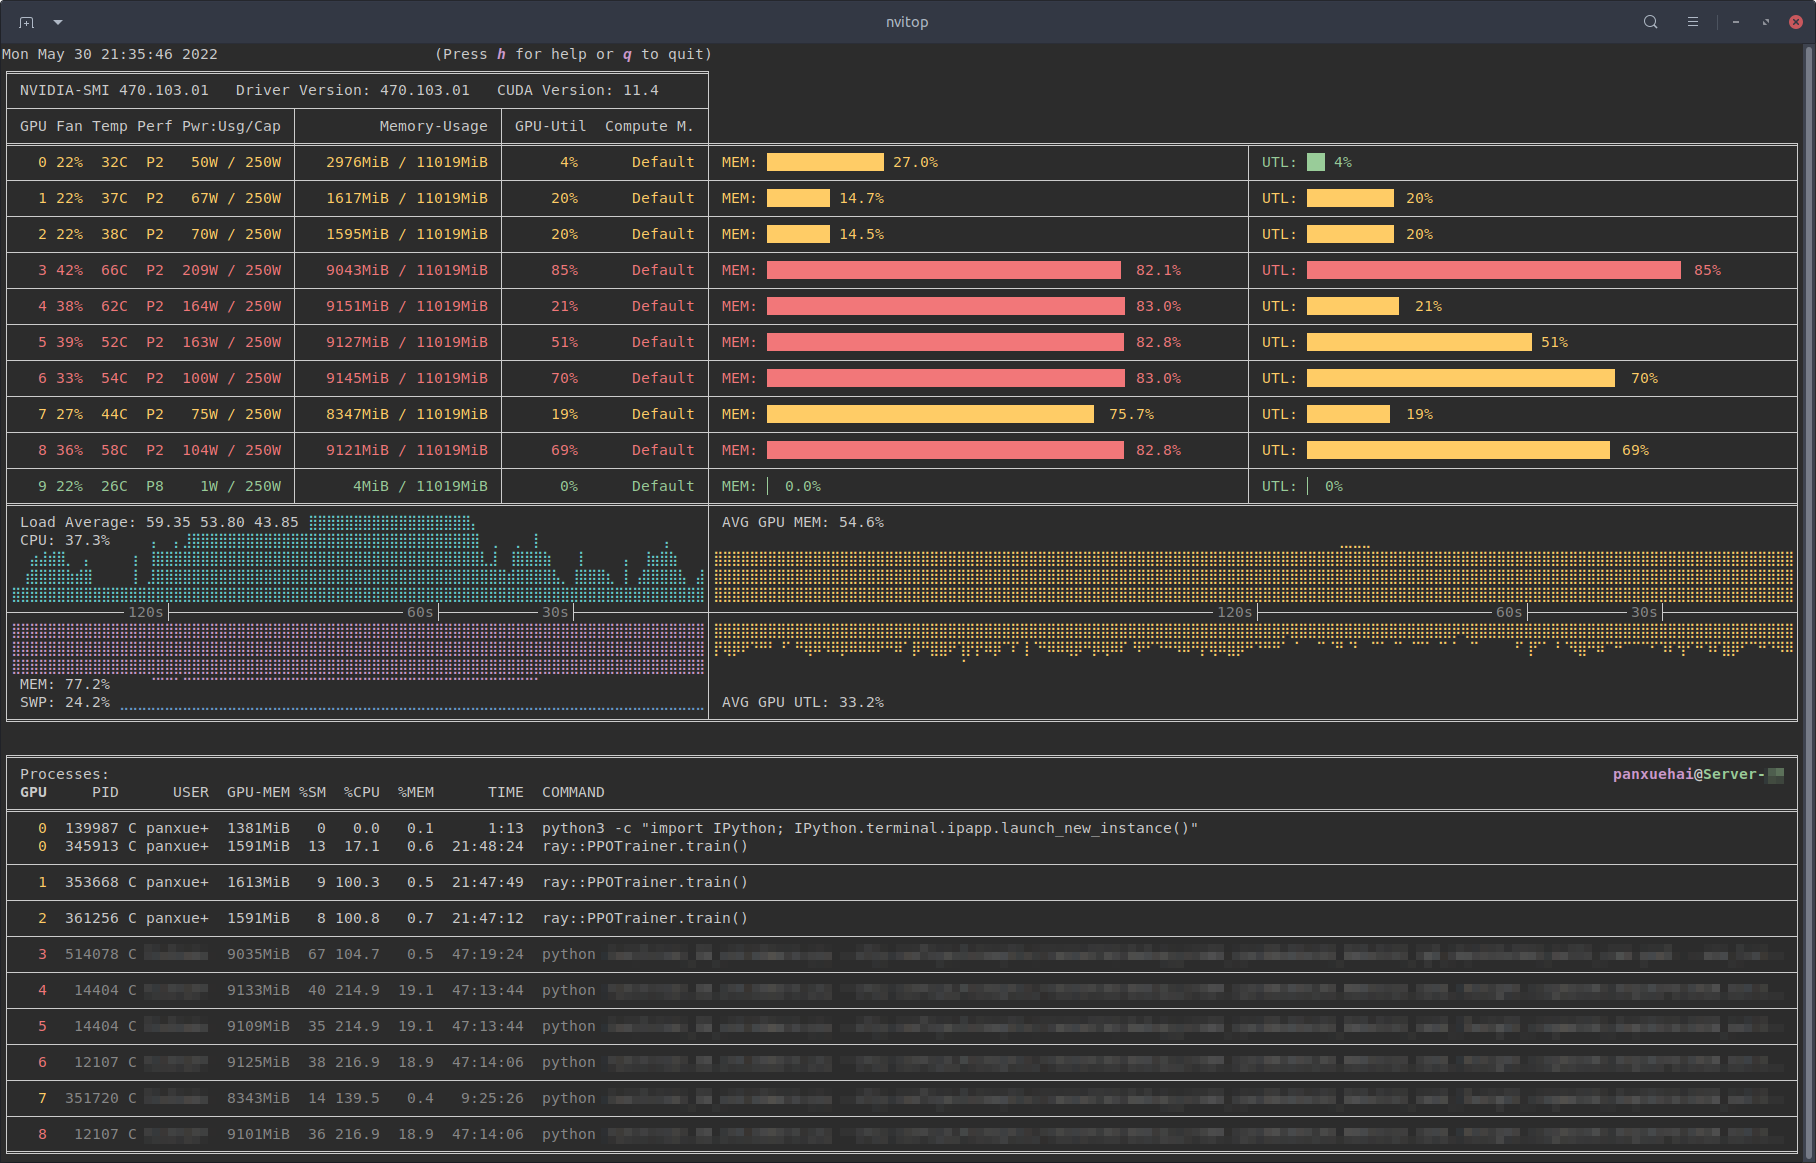
Running nvitop without arguments drops you into a live htop-style dashboard. The display refreshes continuously and shows per-GPU memory, utilization, temperature, fan speed, power draw, and a full process table with per-process GPU memory, CPU%, host memory, and runtime. You can sort processes by any column, filter by user or PID, view the full process tree (press t), inspect environment variables (press e), and drill into live metrics graphs for any individual process (press Enter).
Killing a runaway training job is a single keystroke: